Recently, while Googling for client-side performance testing, I came across some recommendations regarding Selenium with JMeter. These suggestions propose writing Selenium scripts in JMeter to interact with the browser while there is an ongoing load simulated on the server by JMeter.
The idea is to mimic a real-world scenario where a substantial load is placed on the server, and one is looking for potential bottlenecks on the client side of the application.
However, I find this approach to client-side testing a bit unrealistic and certainly suitable for experimentation or exploring tools. Nevertheless, it is undoubtedly far from the reality of the situation.
The official documentation of the plugin, which enables the writing of Selenium scripts in JMeter, states that:
The Web Driver Sampler is meant to be run in conjunction with a HTTP Sampler so that from the server's perspective, the load is production like. At the same time, the web sampler will simulate the user experience of interacting with the website/webapp whilst the server is under load, hence measuring the real user's experience at the same time.[source]
In this blog, I will try to outline a few important reasons which suggest that Selenium with JMeter is not an ideal solution for client-side performance testing.
However, before that I would briefly touch upon basic concepts of performance testing to get the familiarity with the subject of our interest.
[Read here: Is exploratory still worth doing in 2024?]
Selenium with JMeter – Basics
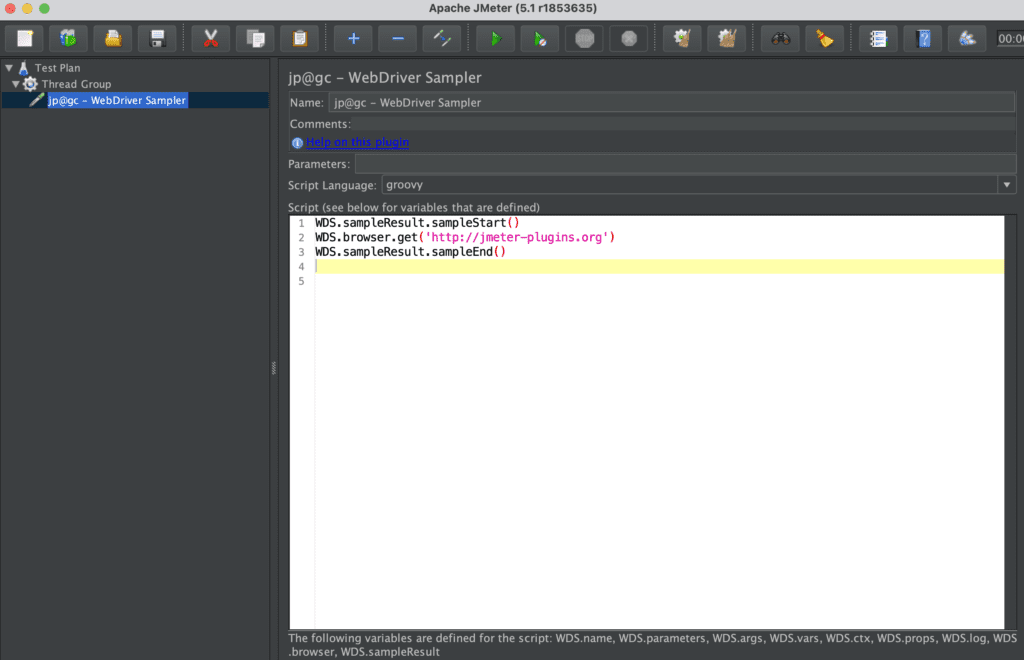
Since, This blog is not about how to write Selenium code in JMeter so I won’t be writing step by step instructions to achieve it. Briefly, there is a plugin (WebDriverSampler) which allows Selenium webdriver code in JMeter. Here is a screenshot from my JMeter setup which shows basic selenium code in it.
Client Side Performance Testing Primer
What is Client Side?
The term ‘client-side’ refers to the part of the application that runs on the user’s device.
For instance, the components required to display this blog properly on your screen are executed on your device. At runtime, the browser makes decisions to help different components of this blog render the content correctly based on the size of your screen.
Key objectives of Client Side performance testing
Client-side performance testing is done to identify the issues related to rendering performance of UI elements.
The primary intent of conducting this type of test is to ensure software is delivered with great user experience and there is no slowness while rendering different the web content on user’s device.
Factors Impacting Client-Side Performance
# 1 – Java Script Execution Time
JavaScript execution time refers to the time it takes for a web browser to process and run JavaScript code user’s device. Understanding and optimising JavaScript execution time is crucial for ensuring faster rendering process.
JavaScript execution in a browser depends on various factors including poor choice of frameworks, data heavy operation, complex business logics at client side, lack of minification, compression etc.
# 2 – Slow API Response from Server
Very obvious, slow api response from server will make the rendering process slower in the browser.
# 3 – Large Number of Http Calls
A large number of http calls to render a page can impact the client-side performance leading to poor user experience.
# 4 – No Cache
Failure to leverage browser caching for static resources can result in repeated downloads, slowing down page loading. Additionally, the data which is going to be static all the time can also be cached at browser for faster rendering.
# 5 – Device Capability, orientation, size, etc
Different device size, plugins installed in browsers blocking javascript process, outdated browser, every thing come into count as that can delay the rendering process leading to poor user experience.
# 6 – Huge CSS
CSS has significant impact on client side performance. For example, Larger CSS files take longer to download, especially on slower network connections which will delay the rendering process.
Why Selenium with JMeter Falls Short in Client-Side Performance Testing
As we have seen above, there are various factors that can act as bottlenecks for front-end components. Therefore, our strategy for testing client-side performance should encompass these probable factors to simulate real-world situations.
Although JMeter allows integration with Selenium code, it neither provides all the crucial statistics necessary for measuring client-side performance nor can it accurately mimic real-world usage scenarios.
Here are a few key reasons that strongly advise against using this combination for client-side performance testing:
Limitations and Challenges
#1 Limited ability to create real world usage scenarios
There is no doubt that about JMeter’s capacity to create server-side, which can result in slow API responses. However, to create client-side performance test environment needs much more attention than just putting huge load on server.
For an instance, if your server is efficient, creating a substantial load to induce slow responses might be challenging to induce slowness in the api response, you have might have to look for distributed setup of JMeter to increate the load which can be over-engineering the client side performance testing.
Furthermore, in the microservices landscape, it’s plausible that huge load on server may serve slow responses from one microservice while others operate normally. This situation fails to replicate real-world conditions for client-side performance testing. If slowness is confined to just one service, it might not manifest as a significant impact on client-side performance.
To truly simulate real-world scenarios, we need a testing solution where all services, including static file serving, experience delays. This approach helps identify genuine front-end performance issues. Consequently, it becomes imperative to explore alternatives to JMeter for a more comprehensive client-side performance evaluation.
#2 Limited Reporting
JMeter lacks the reporting capability essential for comprehensive client-side performance testing.
As indicated on the official page of WebDriversSampler, it primarily captures only the time taken to complete the rendering of a page. However, client-side performance demands more detailed reports, such as identifying which CSS or JavaScript files are causing delays. In many cases, pinpointing dynamic web elements that impede the rendering process is also crucial. Unfortunately, JMeter falls short in capturing these minute-level details in its reports.
Furthermore, the ability to capture videos or screenshots of a slow rendering process is challenging to achieve in JMeter. Even if accomplished, it introduces its own maintenance costs and efforts.
#3 Lack of Performance Metrics
TTFB (Time to First Byte): Measures the time from request initiation to receiving the first byte of the server response.
Start Render: Indicates the time for the first non-blank content to appear on the user’s screen during page load.
FCP (First Contentful Paint): Marks when any content, including text or images, is first rendered on the screen.
LCP (Largest Contentful Paint): Measures the render time of the largest content element within the viewport.
CLS (Cumulative Layout Shift): Quantifies unexpected layout shifts during page loading, assessing visual stability.
TBT (Total Blocking Time): Cumulative duration the main thread is blocked, impacting user interactivity.
DC Time (Data Transfer Time): Measures the time taken for data transfer from server to client during page loading.
Total Time: Overall time taken for the entire page to load and become fully interactive.
Total Request: The total number of requests made by the browser to load all page resources.
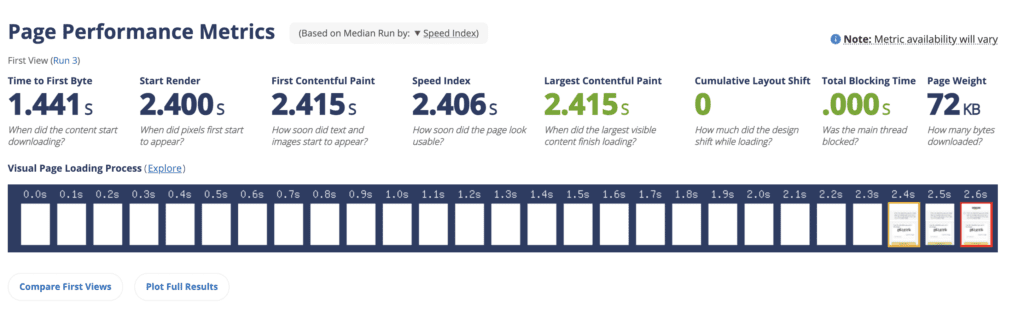
While these metrics are crucial for understanding client-side performance, JMeter, unfortunately, does not support the direct measurement or reporting of these metrics. JMeter’s reporting capabilities primarily focus on server-side metrics, making it less suitable for capturing the intricate details related to the client-side user experience. To obtain a comprehensive view of client-side performance, exploring alternative tools with support of crucial metrics is recommended.
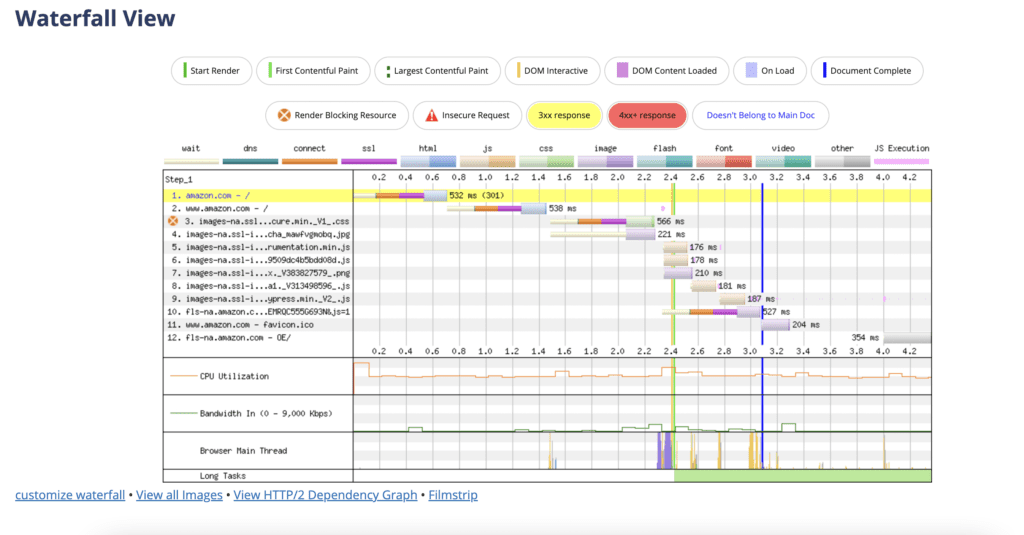
Below is another reporting aspect of client-side performance testing, where in you get to know time taken to complete various http calls on a waterfall view. It clearly shows which calls are delaying the page load.
#4 Duplicity of Effort
When focusing solely on client-side performance testing, a crucial consideration with Selenium and JMeter is the duplicity of effort.
The process involves initially developing JMeter scripts to generate server-side load, followed by integrating Selenium scripts into JMeter to launch browsers and test the client side. This approach involves a twofold effort, as the creation of scripts for server-side load generation requires time and effort. Additionally, to comprehensively cover various pages for client-side performance, extensive JMeter scripting becomes necessary.
This dual effort extends resources and time investment, leading to duplicative work on two distinct aspects of the testing process.
Alternative Tools for Client-Side Performance Testing
While Selenium with JMeter attempts to address client-side performance testing, exploring alternative tools and approaches can offer more robust solutions that align with the intricacies of modern web applications. Let’s delve into a few alternatives that outshine this combination:
#1 WebPageTest
Features:
- Real User Monitoring (RUM): Provides insights into how real users experience your website.
- Detailed Metrics: Captures a comprehensive set of performance metrics, including FCP, LCP, and TBT.
- Geographic Testing: Allows testing from multiple geographic locations to simulate diverse user scenarios.
Advantages over Selenium with JMeter:
- Real User Experience: WebPageTest prioritizes the real user experience, providing nuanced metrics that reflect actual user interactions.
- Global Perspective: Offers a global perspective by simulating users from different locations, allowing for a more realistic testing environment.
#2 Lighthouse
Features:
- Built-in Audits: Includes audits for performance, accessibility, SEO, and more.
- Integration with DevTools: Can be run as a Chrome DevTools extension or from the command line.
- Scoring System: Provides a performance score based on various metrics.
Advantages over Selenium with JMeter:
- Holistic Auditing: Goes beyond performance testing to cover accessibility, SEO, and other crucial aspects.
- Integrated with Chrome: Seamless integration with Chrome DevTools streamlines testing within the development workflow.
- Easily added to your functional UI tests. UI automation tools like Cypress and PlayWright has support to integrate with LightHouse.
#3 GTmetrix
Features:
- Page Speed Scoring: Assigns scores based on Google’s PageSpeed Insights.
- Waterfall Chart: Visualizes the loading sequence of resources.
- Recommendations: Offers actionable recommendations to improve performance.
Advantages over Selenium with JMeter:
- User-Friendly Interface: GTmetrix provides a user-friendly interface with detailed performance scores and actionable insights.
- Easy Comparison: Enables easy comparison with historical data to track performance improvements over time.
Comparative Analysis
| Criteria | Selenium with JMeter | Alternative Tools |
|---|---|---|
| Real User Monitoring (RUM) | Limited focus on real user experience. | Emphasizes capturing insights from actual user interactions. |
| Comprehensive Metrics | Primarily captures basic rendering time. | Provides a rich set of metrics, including FCP, LCP, and TBT. |
| Global Testing Capabilities | Limited to server-side load testing. | Simulates users from various locations for a global perspective. |
| Holistic Auditing | Primarily focused on performance testing. | Covers performance, accessibility, SEO, and other critical aspects. |
| Integration with Chrome | Requires additional integration efforts. | Seamlessly integrated with Chrome DevTools for an efficient workflow. |
| User-Friendly Interface | Requires familiarity with JMeter interface. | Offers a user-friendly interface with detailed performance insights. |
[Read what are the fundamental questions for a QA to ask before they test]
Conclusion and Next Step
As discussed above, client-side performance testing with Selenium and JMeter has intricate challenges that go beyond the surface-level mimicry of server loads. While the combination attempts to simulate real-world scenarios, its limitations become evident when scrutinizing the diverse and dynamic nature of modern web applications.
Alternative tools such as WebPageTest, Lighthouse, and GTmetrix offer features that address the limitations observed with Selenium and JMeter. Real user monitoring, comprehensive metrics, and user-friendly interfaces make these tools more suitable for capturing the intricacies of client-side performance.
To receive such insightful articles directly to your inbox, subscribe to our newsletter.
FAQs
Selenium with JMeter is used, but it has limitations in reporting and metrics, making it suboptimal for in-depth client-side performance analysis.
Challenges include duplicity of effort, requiring separate scripts for server-side and client-side testing, limited real-world scenario simulation, and insufficient reporting capabilities for nuanced analysis.
Metrics such as Time to First Byte (TTFB), First Contentful Paint (FCP), Largest Contentful Paint (LCP), Cumulative Layout Shift (CLS), Total Blocking Time (TBT), Data Transfer Time (DC Time), Data Transfer Requests (DC Request), Total Time, and Total Request are crucial for a comprehensive client-side performance analysis.
JMeter lacks detailed reporting capabilities, particularly in capturing minute-level details like specific CSS or JavaScript files causing delays. This limitation hampers a thorough analysis of client-side performance issues.
Slow API responses from the server can significantly impact the rendering process in the browser, leading to delayed page loading and an overall poor user experience.
Thank you for reading this post, don't forget to subscribe!
No responses yet